Table of Contents
Elixir Forum Survey 2018 Results
This survey was conducted by Adolfo Neto, Fabio Negrini and Diego Paolo Tsutsumi from the Federal University of Technology - Paraná (UTFPR) in Brazil. We wanted to understand how software developers use the Elixir Forum. The respondents answered between November 29th, 2018 and December 6th, 2018.
There were 134 responses.
Gender
| Gender | Quantity | Percentage |
|---|---|---|
| Male | 129 | 96.3% |
| Female | 1 | 0.7% |
| Other | 2 | 1.5% |
| Prefer not to say | 2 | 1.5% |
Age
| Range | Quantity | Percentage |
|---|---|---|
| <15 | 0 | 0% |
| 15-19 | 2 | 1.5% |
| 20-29 | 49 | 36.6% |
| 30-39 | 54 | 40.3% |
| 40-49 | 22 | 16.4% |
| 50+ | 7 | 5.2% |
Average age: 33.55 (considering last interval as 50-70)
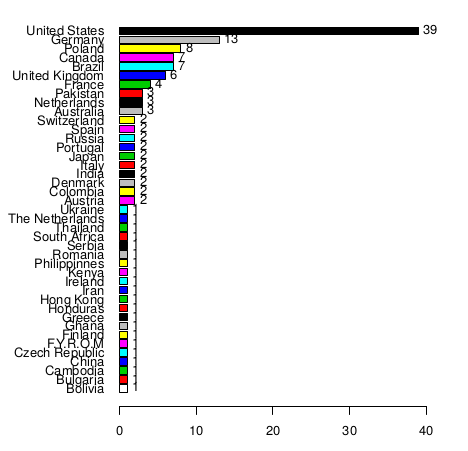
Country of residence
                Frequency Percent Cum. percent
United States          39    29.1         29.1
Germany                13     9.7         38.8
Poland                  8     6.0         44.8
Canada                  7     5.2         50.0
Brazil                  7     5.2         55.2
United Kingdom          6     4.5         59.7
France                  4     3.0         62.7
Pakistan                3     2.2         64.9
Netherlands             3     2.2         67.2
Australia               3     2.2         69.4
Switzerland             2     1.5         70.9
Spain                   2     1.5         72.4
Russia                  2     1.5         73.9
Portugal                2     1.5         75.4
Japan                   2     1.5         76.9
Italy                   2     1.5         78.4
India                   2     1.5         79.9
Denmark                 2     1.5         81.3
Colombia                2     1.5         82.8
Austria                 2     1.5         84.3
Ukraine                 1     0.7         85.1
The Netherlands         1     0.7         85.8
Thailand                1     0.7         86.6
South Africa            1     0.7         87.3
Serbia                  1     0.7         88.1
Romania                 1     0.7         88.8
Philippinnes            1     0.7         89.6
Kenya                   1     0.7         90.3
Ireland                 1     0.7         91.0
Iran                    1     0.7         91.8
Hong Kong               1     0.7         92.5
Honduras                1     0.7         93.3
Greece                  1     0.7         94.0
Ghana                   1     0.7         94.8
Finland                 1     0.7         95.5
F.Y.R.O.M               1     0.7         96.3
Czech Republic          1     0.7         97.0
China                   1     0.7         97.8
Cambodia                1     0.7         98.5
Bulgaria                1     0.7         99.3
Bolivia                 1     0.7        100.0
Mutiple choice questions
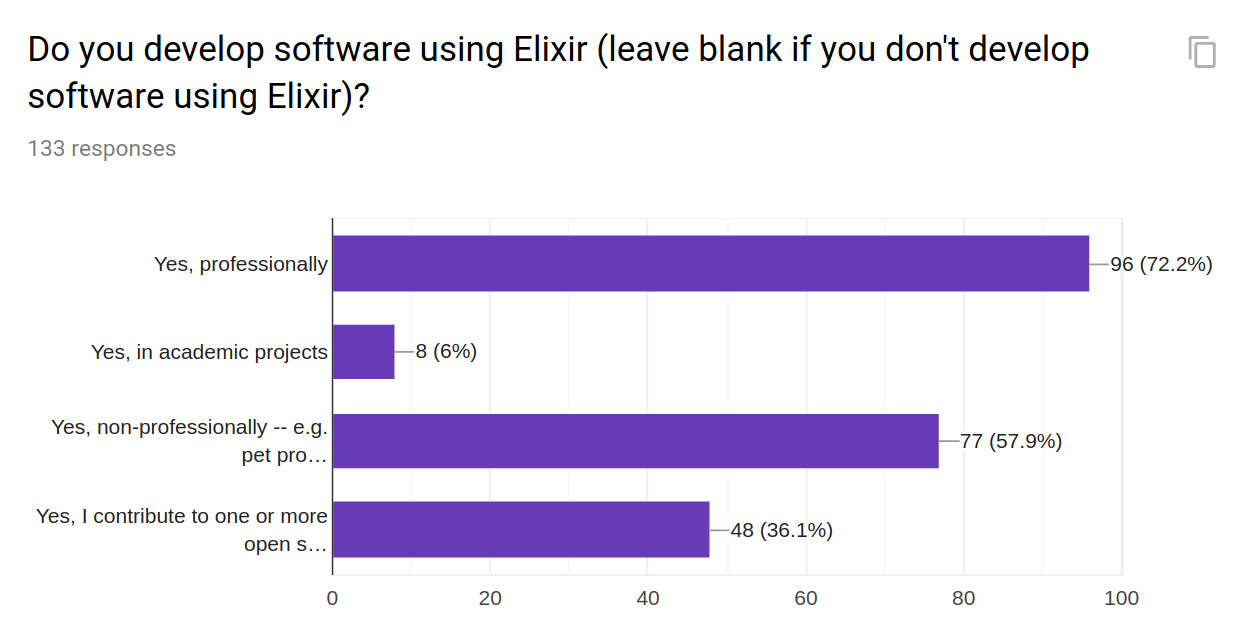
Do you develop software using Elixir (leave blank if you don't develop software using Elixir)?
Respondents could choose zero or more options.
| Answer | Quantity | percentage |
|---|---|---|
| Yes, professionally | 96 | 72.2% |
| Yes, in academic projects | 8 | 6% |
| Yes, non-professionally – e.g. pet projects, tinkering, … | 77 | 57.9% |
| Yes, I contribute to one or more open source projects (irrespective of size) | 48 | 36.1% |
133 responses.
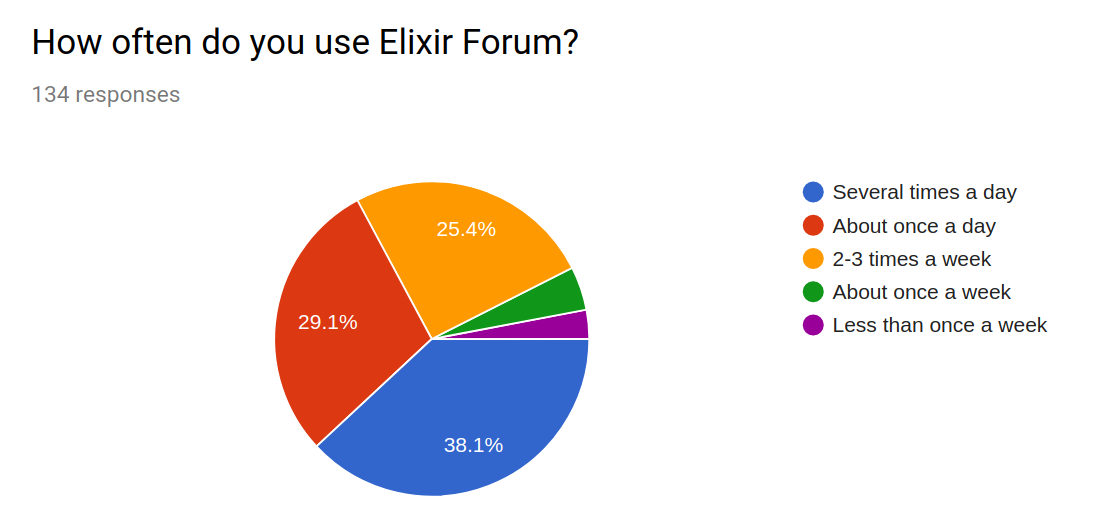
How often do you use Elixir Forum?
| Answer | Quantity | Percentage |
|---|---|---|
| Several times a day | 51 | 38.1% |
| About once a day | 39 | 29.1% |
| 2-3 times a week | 34 | 25.4% |
| About once a week | 6 | 4.5% |
| Less than once a week | 4 | 3% |
134 responses
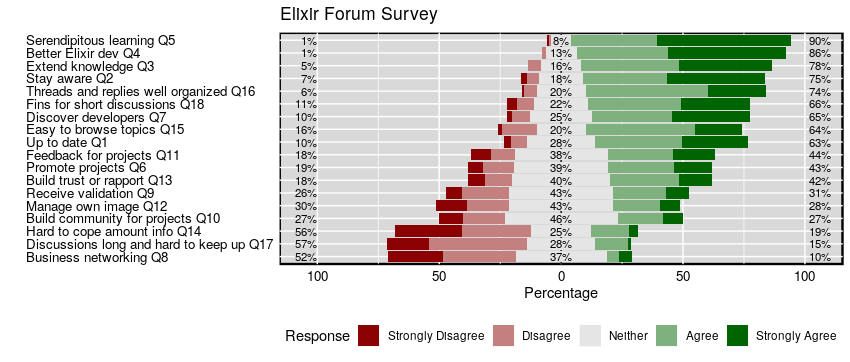
Likert-scale questions
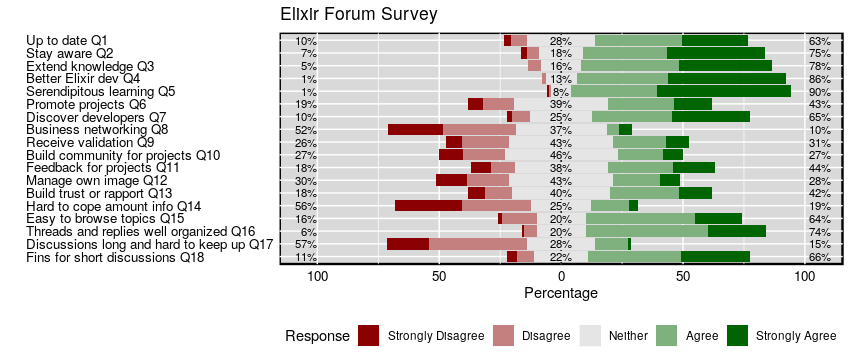
Respondents could choose between five options ranging from “Strongly Disagree” to “Strongly Agree”.
- Q1 Elixir Forum helps me keep up to date about new tools such as packages and IDE's.
- Q2 Elixir Forum helps me stay aware of new practices and methods in Elixir language
- Q3 Elixir Forum helps me extend my knowledge by exposing me to technologies and practices I should learn in the Elixir language
- Q4 Elixir Forum has helped me become a better Elixir developer.
- Q5 Elixir Forum helps me learn about things I wasn't actively looking for
- Q6 Elixir Forum helps me promote projects and technologies I work with
- Q7 Elixir Forum helps me discover interesting Elixir developers
- Q8 Elixir Forum helps me do business networking
- Q9 Elixir Forum helps me receive validation from others for my work
- Q10 Elixir Forum helps me build community around projects I contribute to
- Q11 Elixir Forum helps me give and get feedback about projects I work with
- Q12 Elixir Forum helps me manage my own image as a developer
- Q13 Elixir Forum helps me build trust or rapport with other developers
- Q14 I find it hard to cope with the amount of information I receive on Elixir Forum.
- Q15 It is easy to browse Topics I'm interested in
- Q16 Topics threads and replies are well organized
- Q17 Discussions are often too long and hard to keep up with
- Q18 Elixir Forum is fine for short discussions
Multiple choice questions
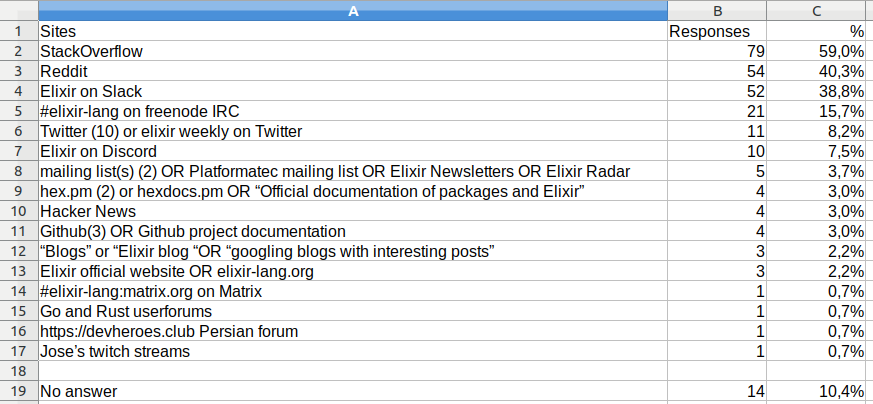
Which other site(s) do you access to get more information about Elixir or software development in general?
120 responses to this question, which was optional and multiple choice.
Options that appeared on the form:
- StackOverflow
- Reddit
- Elixir on Slack
- Elixir on Discord
- #elixir-lang on freenode IRC
Any questions, comments or concerns you'd like to tell us about?
- On some questions an answer option 'cannot rate' would be an improvement.
- I interact with the “forum” almost entirely through email so some of these questions don't apply at all.
- The biggest factor for the forum in my point of view, is the extended discussions and posts that many times go into even other directions than elixir
- Good luck with your survey :)
- Cheers!
- I mainly use the forum to solve problems I encounter.
- Thank you!
- The elixir forum is the most friendly developer community I've come across.
- Why are you doing this research?
- Nope.
- Great job compiling this form. Looking forward to the results!
